Hyperscanning series part 5: How to analyze a hyperscanning dataset with BrainVision Analyzer 2

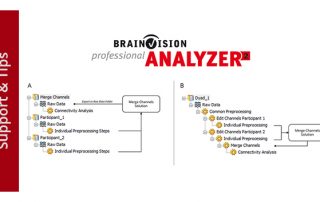
In this article we will dip into common analysis goals for hyperscanning and why they are relevant for research fields such as social neuroscience. We will focus on dealing with multi-participant datasets and inter-brain connectivity in BrainVision Analyzer 2 helping you to complete your hyperscanning analysis.

  • Fingerprints of excellence: A great journey towards the new features in BrainVision Analyzer 2.2.0

Fingerprints of excellence: A great journey towards the new features in BrainVision Analyzer 2.2.0

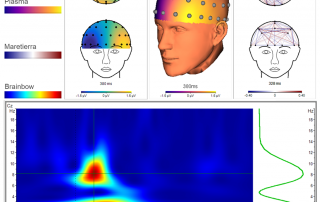
A new major update of our flagship analysis software, BrainVision Analyzer 2, is about to be released. In this article we intend to familiarize you with the most salient features coming with Analyzer 2.2.0, hoping they have a positive impact on your research work.

  • New views made easy – Visualizing ECoG grids & connectivity matrices via Analyzer 2’s MATLAB® transformation

New views made easy – Visualizing ECoG grids & connectivity matrices via Analyzer 2’s MATLAB® transformation

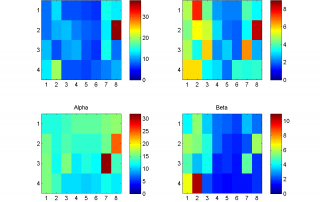
BrainVision Analyzer 2 is easy to use and offers a variety of views to display your data with a single mouse click. However, science develops and new analysis methods entail the need for new data visualizations that Analyzer 2 does not yet support. This article briefly discusses how to expand the view capabilities of Analyzer 2 using the MATLAB® transformation. Two examples will illustrate this feature, where ECoG grid data and EEG connectivity matrices are visualized using simple MATLAB® functions.

2022-02-06T22:08:18+01:00April 21st, 2017|Categories: 2017, Issue 1/2017, Support & Tips|Tags: , , , |
Go to Top