Tricks and Tips in BrainVision Recorder – Part II
by Dr. Stefania Geraci, Dr. Lena Beskers, Clara Guenter, M.Sc. and Hannah Hiebel, M.Sc.
Technical Support Team (Brain Products)
 Our first Recorder Tricks and Tips article proved to be popular with our users, therefore, we decided to put together a follow-up article containing seven further useful hints for the use of BrainVision Recorder.
Overview
Data safety:
→ Managing operator permissions in BrainVision Recorder
Visualization:
→ Optimize your online display for peripheral physiology measurements
→ Montages: How to visualize your data in different ways during recording
→ How to safely use the ‘Switch Off Channel’ option
→ Segmentation and averaging in real-time
Technical details:
→ Vision data file structure in a nutshell
→ Simulated Amplifier: Streaming data without subject and amplifier
→ Understanding the DC-correction feature for BrainAmp DC and BrainAmp MR plus
Managing operator permissions in BrainVision Recorder
Sometimes, reliable laboratory procedures are facilitated by restricting operator interventions. This is why BrainVision Recorder allows the administrator to tailor and restrict operator permissions for standard users. This includes granting permission to create, edit, or select a workspace, to edit Preferences and to edit Amplifier-specific Settings (see Figure 1). To alter these settings, go to Configuration > Administrator.
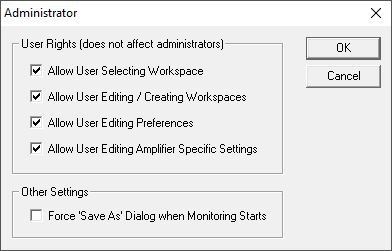
Figure 1: Select user permissions for different functions of BrainVision Recorder.
On the other hand, for a lab manager who may need to switch between the different amplifiers and who uses Recorder’s full functionality, it may be easier to run Recorder with administrator privileges. To do this automatically, right-click on the Recorder icon on your desktop and choose Properties. Then, select the tab Compatibility and choose Run this program as an administrator (see Figure 2). Finally, click on OK. Here you go!
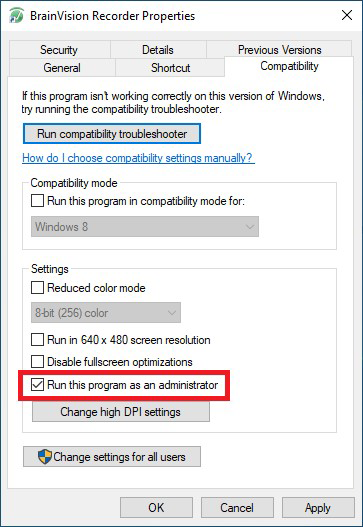
Figure 2: Properties of the BrainVision Recorder Application in Windows® 10.
Optimize your online display for peripheral physiology measurements
Visualization requirements of peripheral physiological signals differ significantly from EEG signals as time scale and amplitude range might be completely different. Using BrainVision Recorder’s “scientific view”, you will be able to adjust time- and amplitude-scaling for each peripheral physiological signal.
Once you start monitoring, you can activate the scientific view by right-clicking on the channel name and selecting Display this channel in a new tab from the context menu (see Figure 3). The appropriate visualization enables you to judge signal quality, detect if the sensor was moved and correct problems during run time.
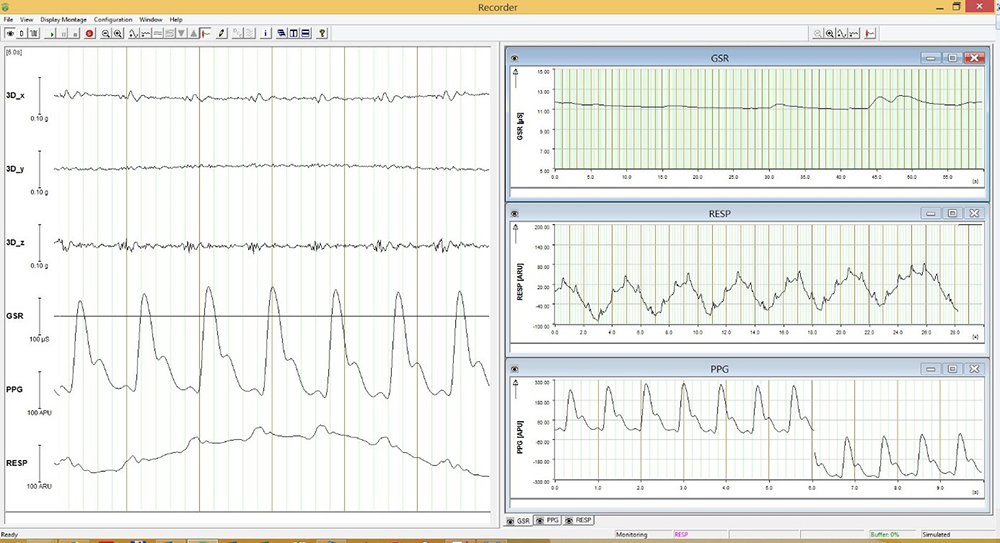
Figure 3: On the left panel, you can see examples of simultaneous recordings from the 3D acceleration sensor (channels 3D_x, 3D_y, 3D_z), GSR sensor (Galvanic Skin Response), Photoplethysmography (PPG) and respiration. You can better detect variations in the peripheral signals by appropriately rescaling the vertical and horizontal axes for each signal (tabs on the right).
Montages: How to visualize your data in different ways during recording
Cognitive neuroscientists tend to have preferences for how to visualize their data. Montages allow you to optimize the way your data is presented in BrainVision Recorder and tailor visualization to your specific needs. If you wish to monitor only a subset of channels, rearrange their sequence, or assign a new reference channel – that’s what Montages are for! If a montage is activated in monitoring or recording mode, only the channels assigned to it will be displayed. Note that montages affect only the visualization while the original (recorded) data remain unchanged.
To create a new montage, select Display Montage > New from the menu and choose one of three reference types (Original, Average, Bipolar; see Figure 4). In the Edit dialogue, assign channels to the montage by manually entering their names or selecting them from the dropdown list. Once you’re finished, save the new montage under any chosen name (e.g., Original1.mont). To display a montage, call it from the Display Montage menu or via a simple keyboard shortcut. In Display Montage > Options up to nine keyboard shortcuts can be assigned that allow you to quickly switch between multiple montages (see Figure 5).
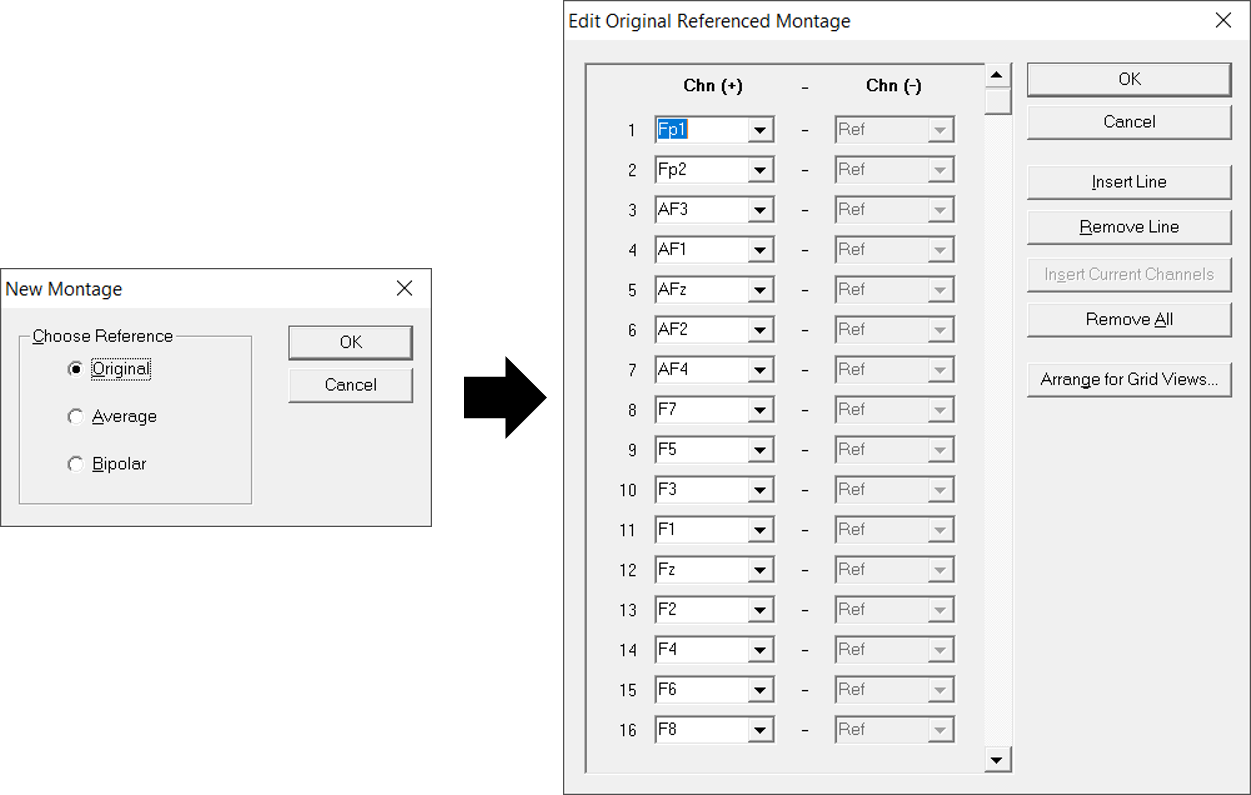
Figure 4: To create a new montage, select Display Montage > New Montage from the menu and choose a reference type in the New Montage dialogue. Assign channels of interest to the montage in the Edit dialogue, press OK and save the montage under a chosen name (*.mont).
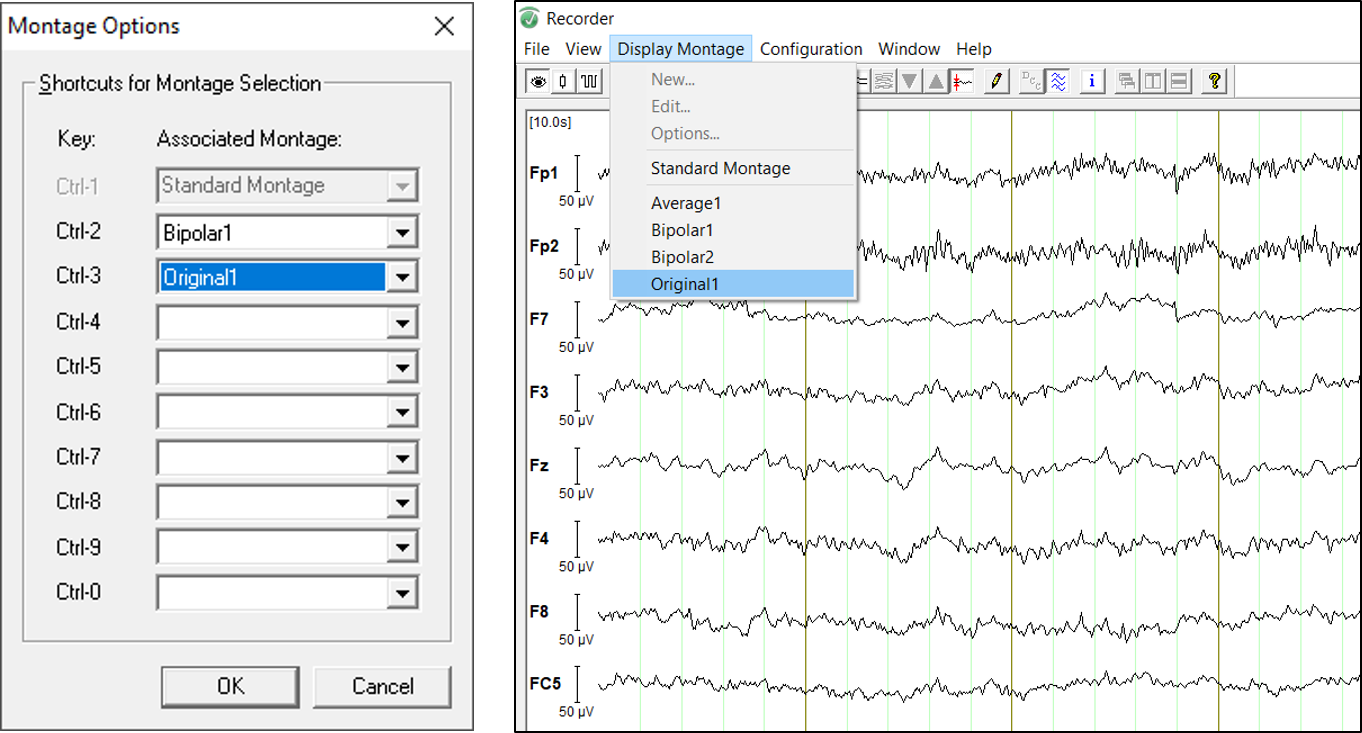
Figure 5: Via Display Montage > Options, keyboard shortcuts can be assigned to predefined montages (left). To display a montage, use the keyboard shortcut or call it from the Display Montage menu (right).
How to safely use the ‘Switch Off Channel’ option
If high-amplitude artefacts on a certain channel obscure the other signals during monitoring, it can be quite useful to switch off this channel. However, be careful with this option during recording! If a channel is switched off during recording, this will not only block the visualization of the signal from the current display, but the information from this channel will also be permanently lost. This occurs only during the time the switch off option is active.
As long as you keep this in mind, to switch off a channel, simply right-click on the respective channel name and select Switch Off Channel <XXX> from the dropdown menu (see Figure 6). The corresponding signal will then be highlighted in red. To reactivate the channel, follow the same process and select Switch On Channel <XXX> from the dropdown menu.
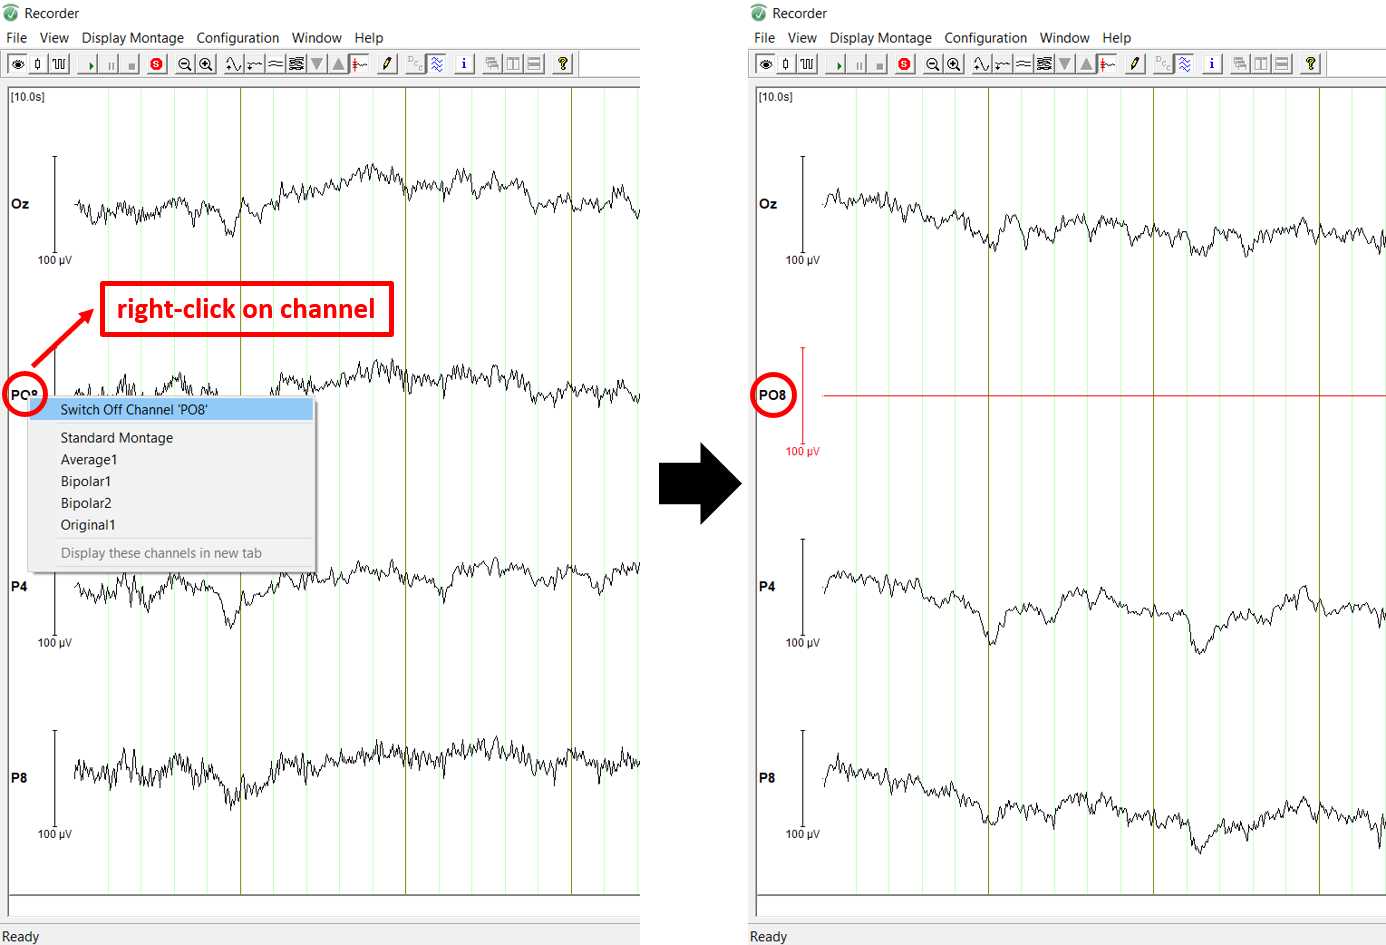
Figure 6: To switch off a channel, right-click on the channel name and select Switch Off Channel <XXX> from the dropdown menu. The signal from this channel is blocked and the corresponding curve is highlighted in red.
Segmentation and averaging in real-time
Segmentation and averaging in real-time is a helpful feature whenever you want to monitor event-related responses online (e.g., motor threshold in TMS studies, brain stem potentials). BrainVision Recorder allows you to segment your data during recording based on different stimulus or reaction markers (see Figure 7). You can perform many data preprocessing steps in Recorder (e.g., filtering in the dialogue Software Filters > Segmentation Filters, segmentation, baseline correction, artefact rejection, and averaging in the dialogue Segmentation/Averaging). Up to 16 groups with different segmentation parameters can be defined and shown online in separate windows. The segmented or averaged data can be saved in parallel with the raw data.
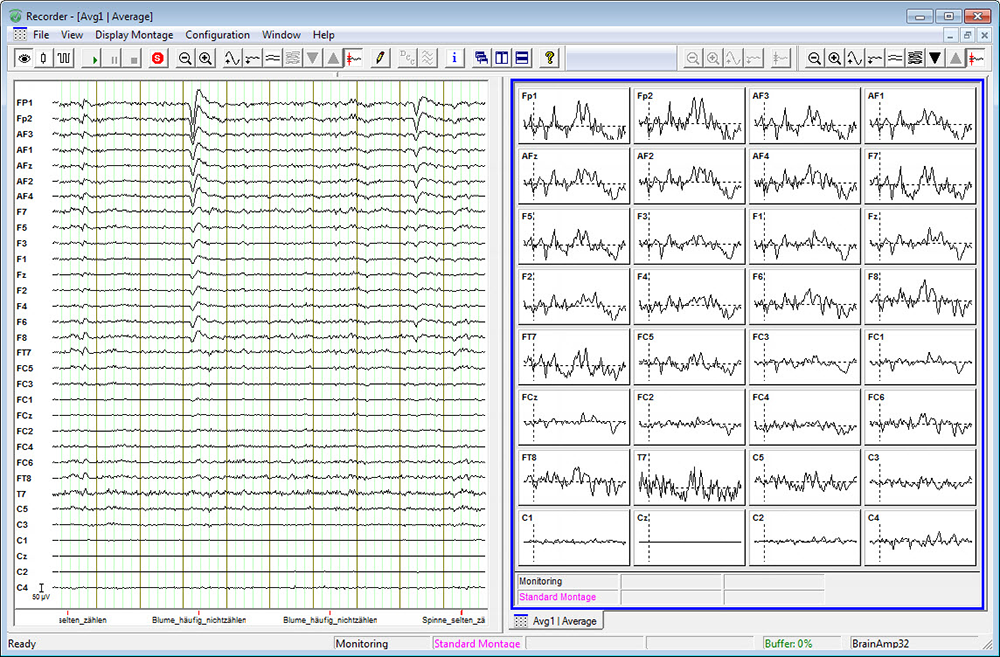
Figure 7: The recorded raw data are shown in the left-hand panel while the right-hand panel shows the segmented or averaged data. Tabs allow you to switch between the different groups if more than one segmentation or averaging group was defined.
To enable segmentation/averaging, open the workspace wizard (File > New Workspace or File > Edit Workspace) and click on Next until the dialogue Segmentation/Averaging is reached (see Figure 8). Now you can create groups and specify the parameters of the group, e.g., relevant stimulus or reaction markers, length of the interval, whether or not Baseline Correction and Averaging should be applied. With this handy tool, you’re able to see your event related responses evolve in real-time as your experiment runs.
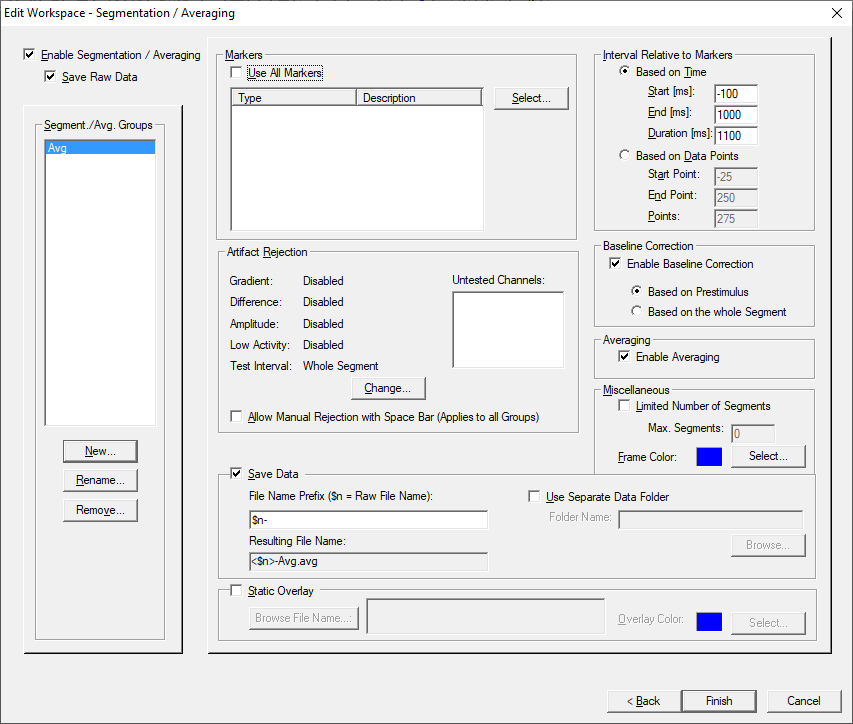
Figure 8: Within the segmentation/averaging dialogue box, you can specify the parameters for different segmentation and averaging groups.
Vision data file structure in a nutshell
Technical Support regularly asks for raw data files for the purpose of troubleshooting. However, we often get data which BrainVision Analyzer is unable to open because file names were changed. This tip introduces the BrainVision data file structure.
BrainVision Recorder saves the recorded EEG data in three different files which are linked by internal references:
- The binary data file (.eeg) contains the recorded time series of your EEG.
- The header file (.vhdr) contains general information about the EEG recording such as the number of channels, amplifier settings, software filters, impedance values, references to the .eeg and .vmrk files, etc.
- The marker file (.vmrk) lists all markers present in the EEG data. It lists the markers together with their data point position, timestamps, marker type, description, reference to the .eeg file, etc.
As these three data files are internally linked, you should keep them together. Renaming the files – even identical renaming of this triplet – results in a mismatch between the references in header and marker files and the newly assigned file names. In case you want to rename your files, please contact us for instructions.
If you send us raw data, please send us all three data files, ideally compressed in a zip folder.
Simulated Amplifier: Streaming data without subject and amplifier
For teaching purposes or to test an online processing pipeline, you do not need to continuously stream and record EEG data from a subject. To try out parameters, e.g., for online MR correction or a real-time feedback loop, it is possible to stream back previously recorded data using the Simulated Amplifier in BrainVision Recorder. In Recorder, go to Configuration > Select Amplifier, then select Simulated Amplifier from the drop-down menu (see Figure 9). Create a new workspace and you can now either choose to play back a sinusoid or select a .vhdr file to stream previously recorded EEG data on repeat (see Figure 10). Now you can carry out your tests without actually needing to record data!

Figure 9: Select Simulated Amplifier from the drop-down list.
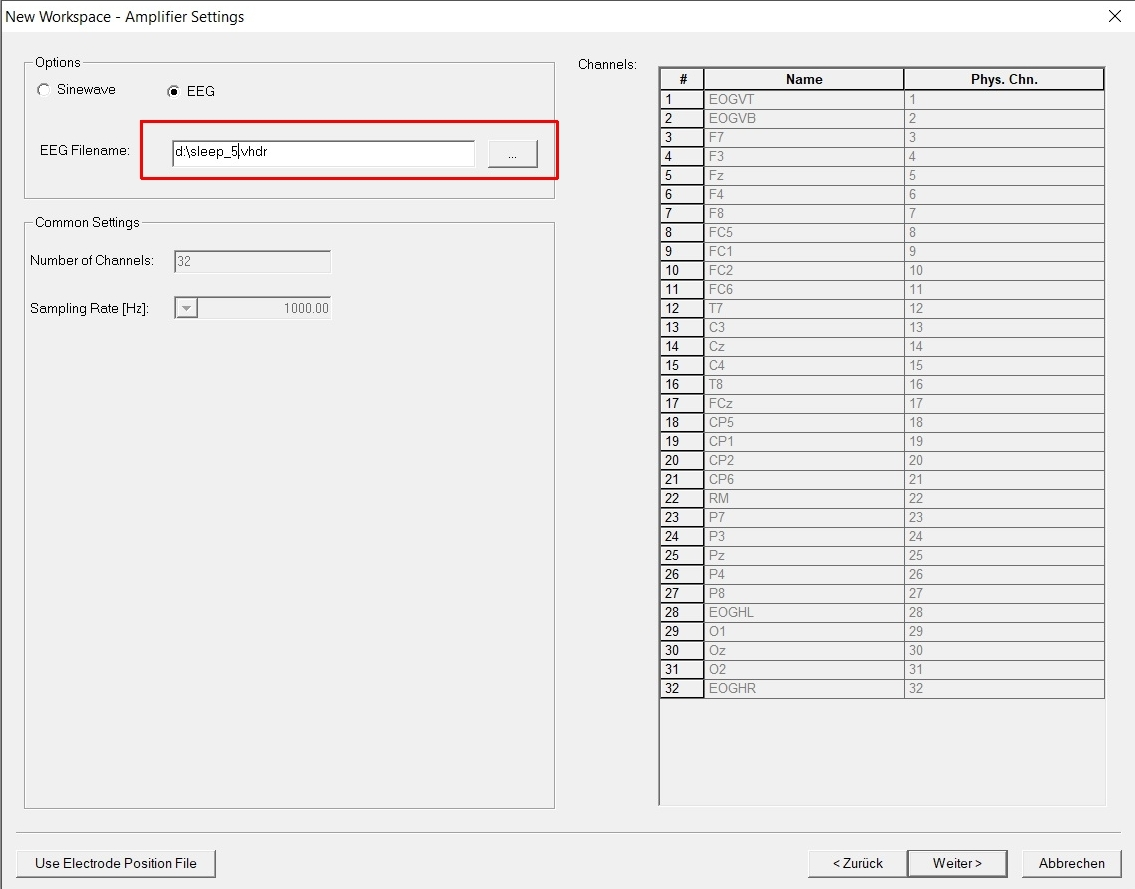
Figure 10: Making a Simulated Amplifier workspace.
Understanding the DC-correction feature for BrainAmp DC and BrainAmp MR plus
Users are often not aware of BrainVision Recorder’s DC-correction feature for BrainAmp MR plus and BrainAmp DC. This feature is provided for all those applications where infraslow oscillations or long-latency ERPs are recorded in the lab or MR environment. An individual readjustment of the input range of each channel is applied to avoid clipping due to excessive signal drift, e.g., in long recording sessions.
If DC-coupling is selected in the workspace, BrainAmp DC and BrainAmp MR plus perform this adjustment when monitoring mode has begun. Ideally, this should be repeated before each experiment block, during prolonged recordings, or in case of excessive drift. There are two different ways to trigger the DC-correction:
(1) DC-correction can be applied either manually via DCC button (see Figure 11) or

Figure 11: DC button in Recorder Window.
(2) remotely controlled either by TTL triggers or via Recorder using remote control server (see Figure 12).
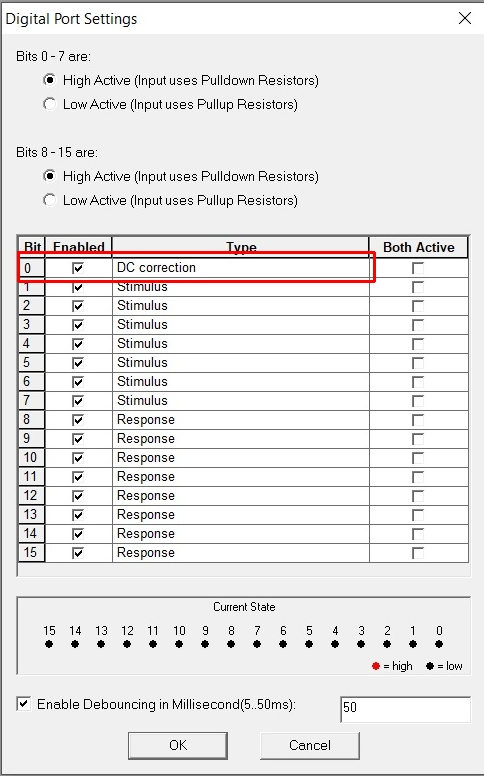
Figure 12: Digital Port Settings with Bit 0 configured for automatic DC-correction.
Now that you know all of the tips and tricks for using BrainVision Recorder, collecting data in your next experimental session should be a breeze.

